Folium Project: Toronto Amenity Scores
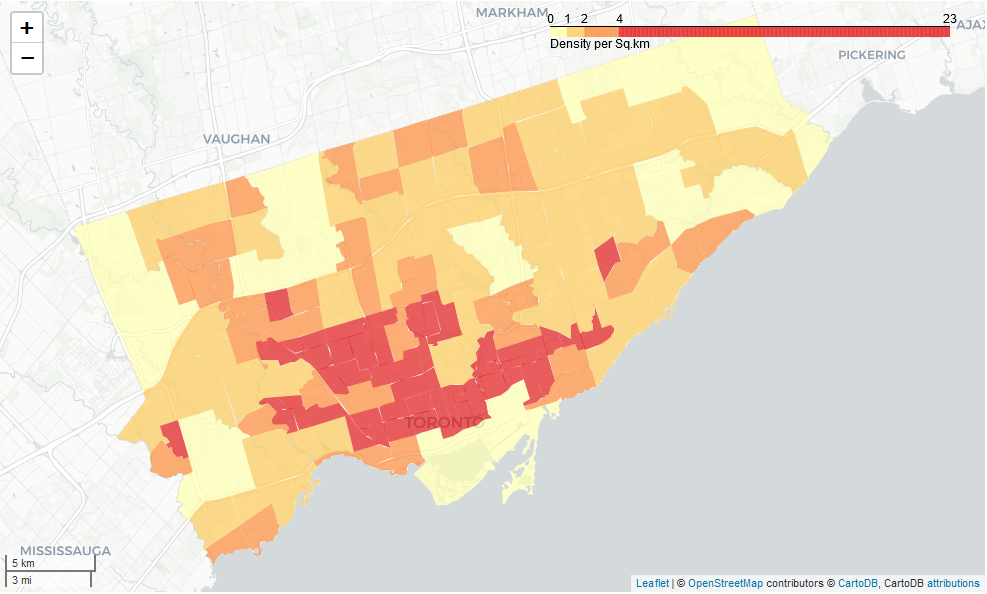
An interactive map displaying the density of selected buildings/amenities in the city of Toronto via OpenStreetMap.
GIS technologist and aspiring Data Analyst skilled in GIS technology, Python, and SQL.
An interactive map displaying the density of selected buildings/amenities in the city of Toronto via OpenStreetMap.
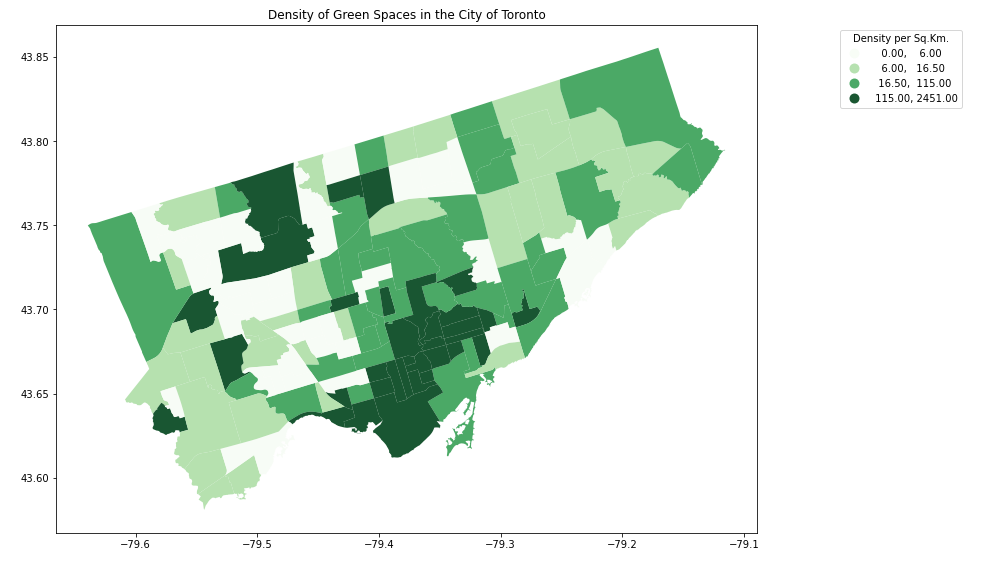
Using Matplotlib, this script depicts the density of green areas in the city of Toronto.
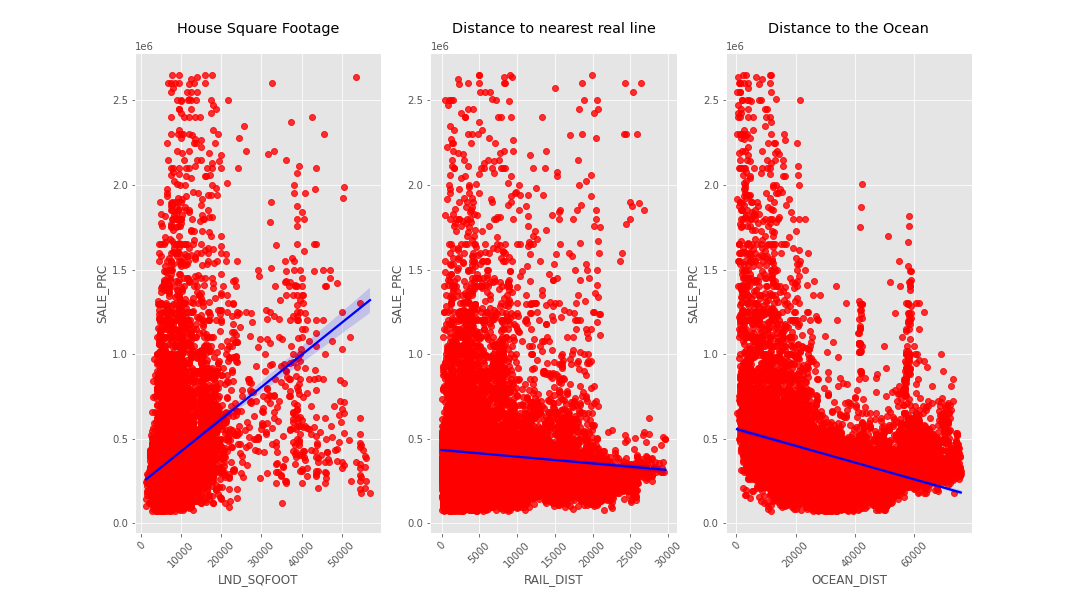
A project exhibiting data correlations and heatmaps using a dataset containing 13,932 single-family homes in Miami, Florida.
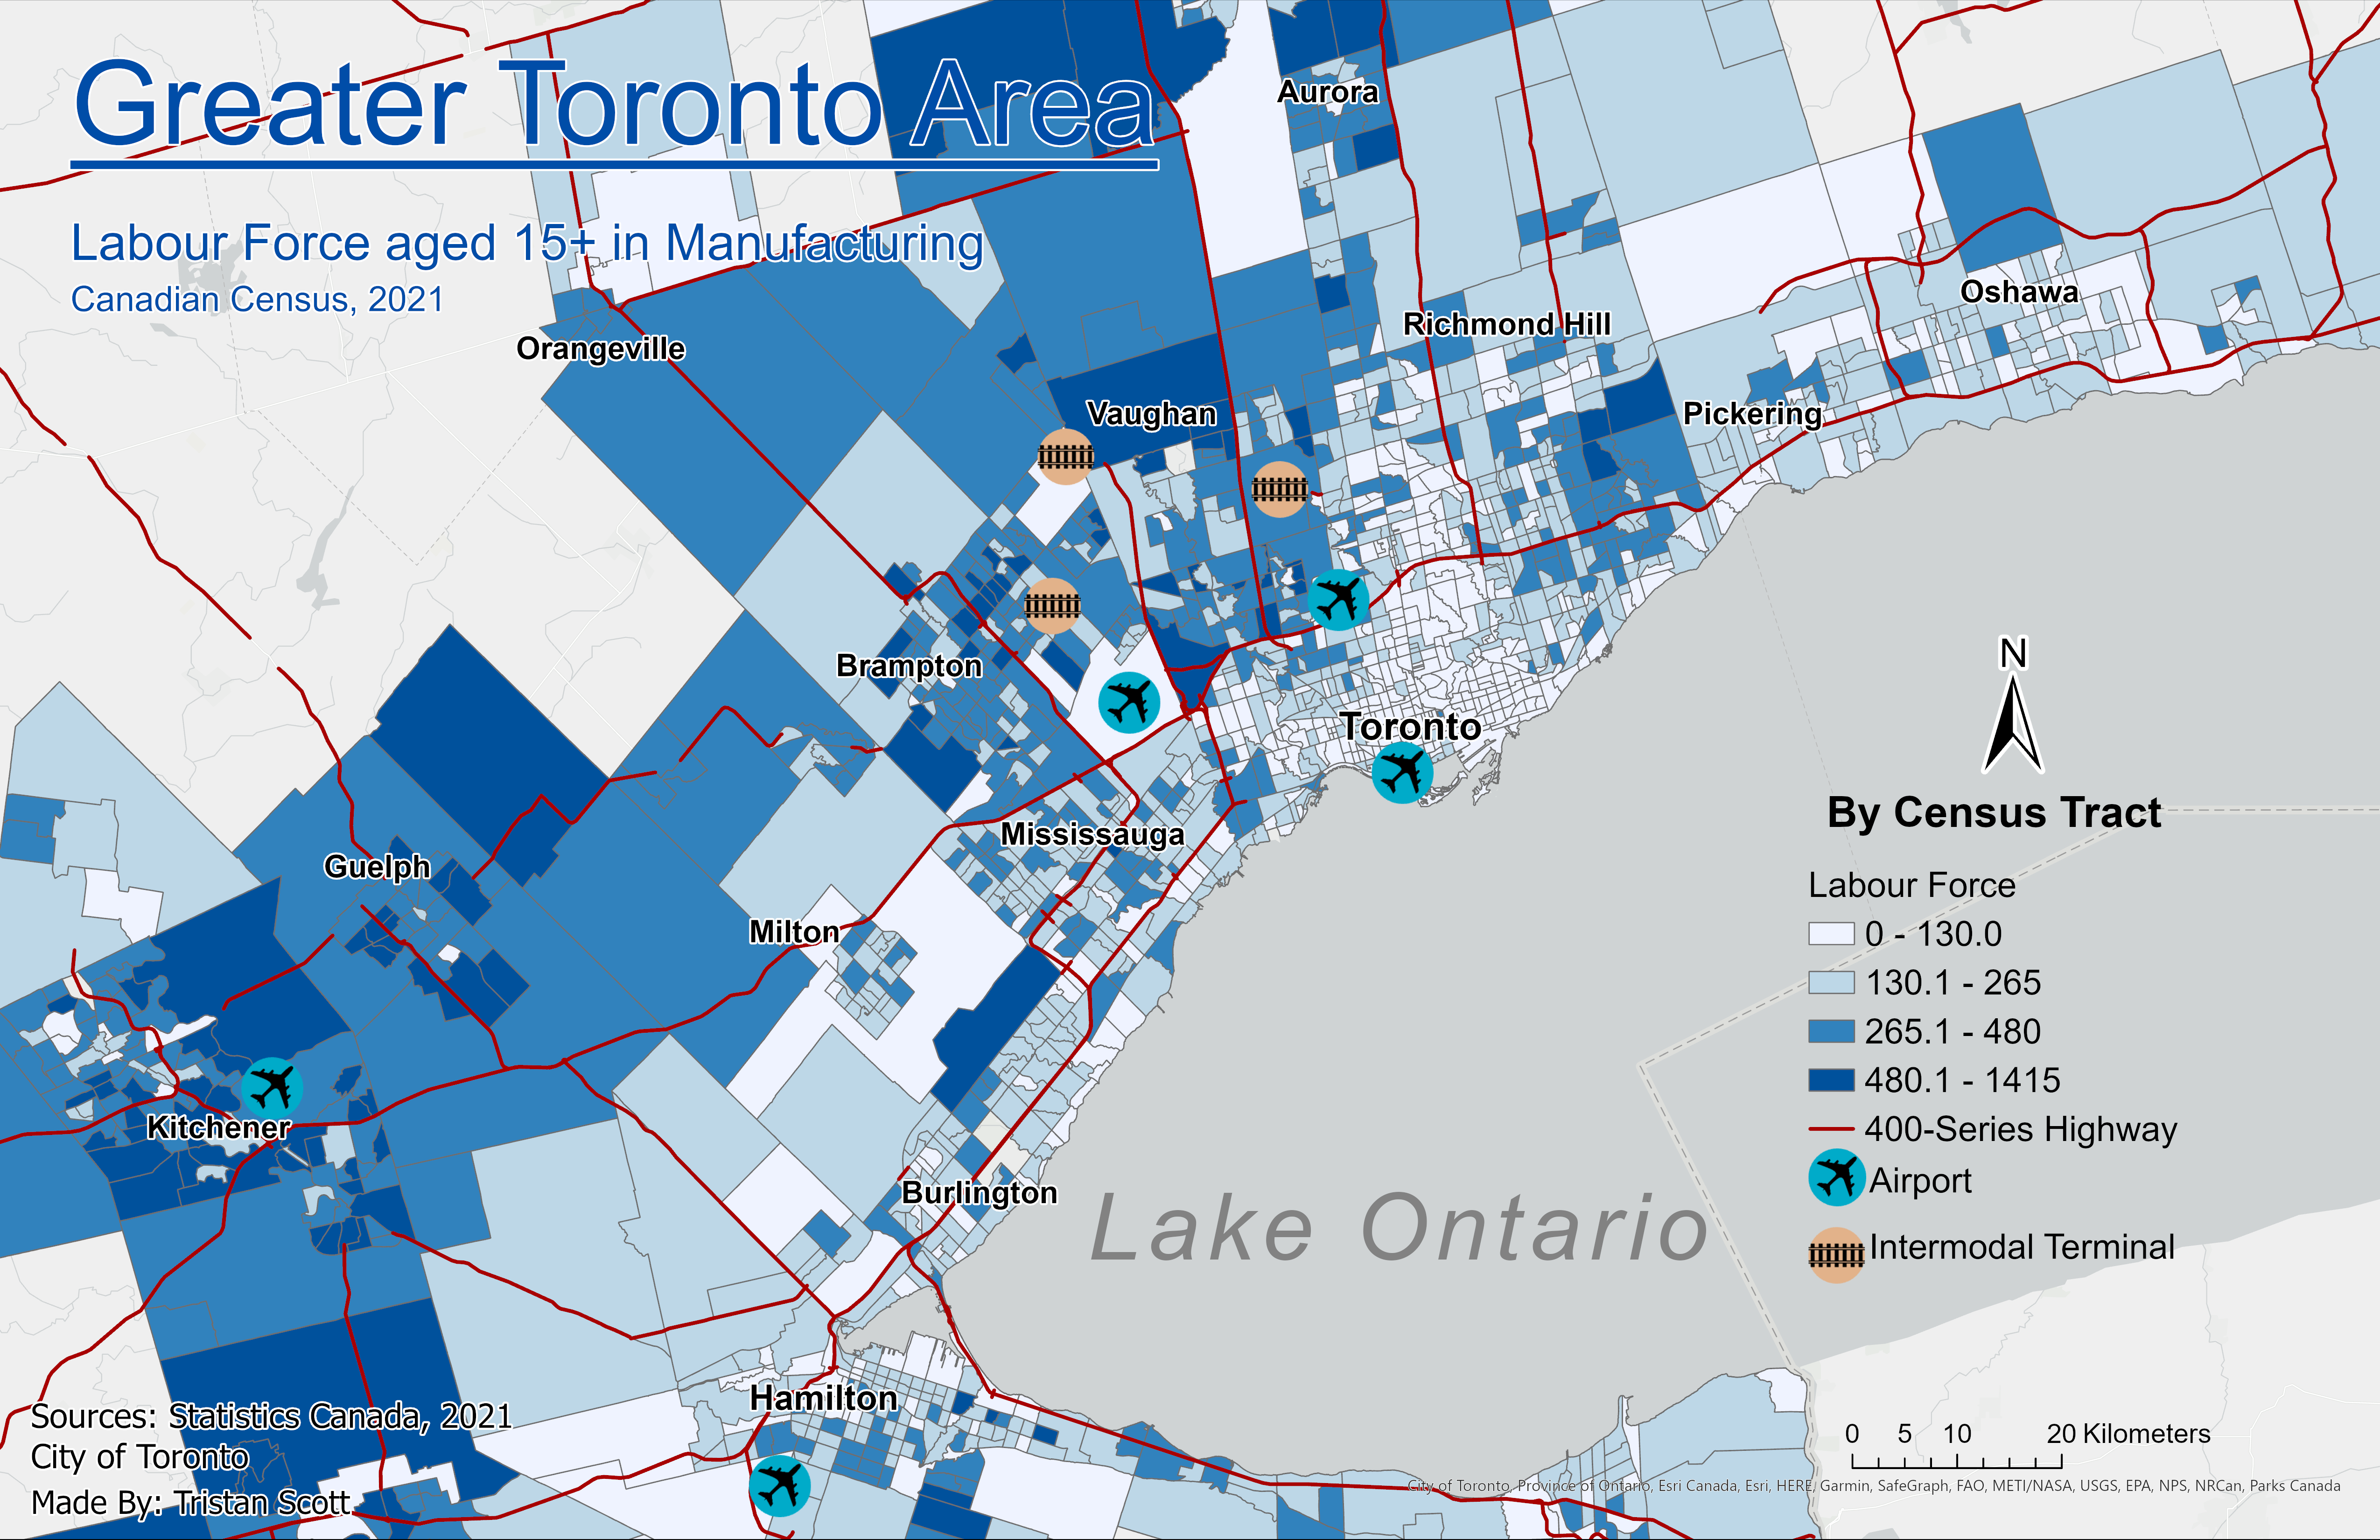
A chloropleth map depicting counts of the GTA's labour force in the area's manufacturing sector, ages 15 and above.
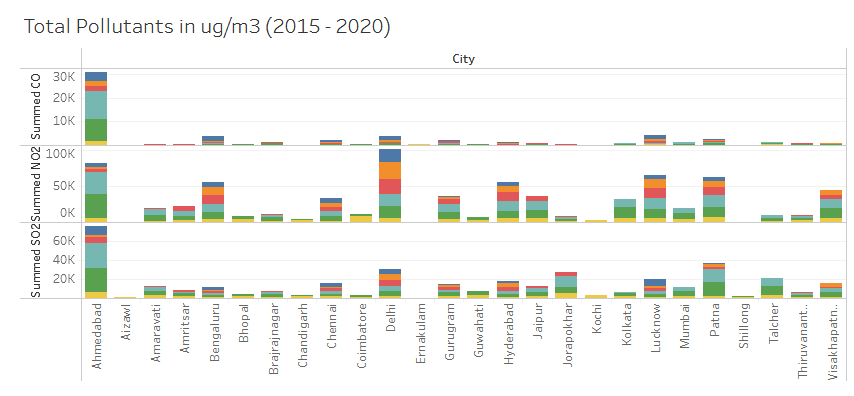
A project visualizing the numbers of SO2, NO2, and CO in a number of Indian cities. Data queried using PostgreSQL and visualized using Tableau.
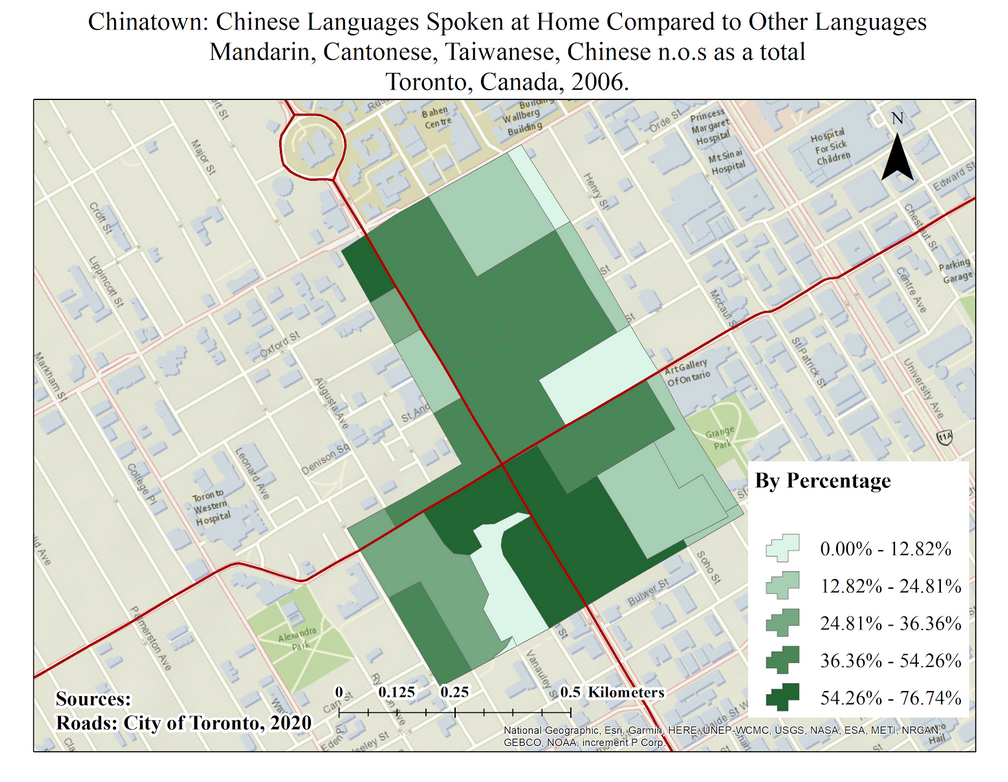
A 2020 class project assessing the prevalence of non-North American restaurants and its associations with ethnic growth in the Torontonian neighbourhoods of Chinatown and the Danforth. ArcMap is used for map visualizations.